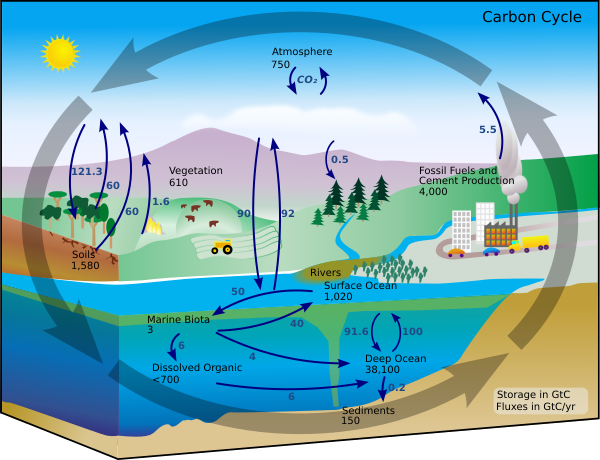
Carbon cycle-cute diagram
Autor:
Credit:
Praca własna, oparta o: Carbon cycle-cute diagram.jpeg (i.e. https://earthobservatory.nasa.gov/features/CarbonCycle)
Krótki link:
źródło:
Wymiary:
600 x 460 Pixel (80450 Bytes)
Opis:
This carbon cycle diagram shows the storage and annual exchange of carbon between the atmosphere, hydrosphere and geosphere in gigatons - or billions of tons - of Carbon (GtC). Burning fossil fuels by people adds about 5.5 GtC of carbon per year into the atmosphere.
Licencja:
Public domain
Komentarz do licencji:
| Ja, właściciel praw autorskich do tej pracy, udostępniam ją jako własność publiczną. Dotyczy to całego świata. W niektórych krajach może nie być to prawnie możliwe, jeśli tak, to: Zapewniam każdemu prawo do użycia tej pracy w dowolnym celu, bez żadnych ograniczeń, chyba że te ograniczenia są wymagane przez prawo. |
Więcej informacji o licencji można znaleźć tutaj. Ostatnia aktualizacja: Tue, 22 Nov 2022 18:20:44 GMT
