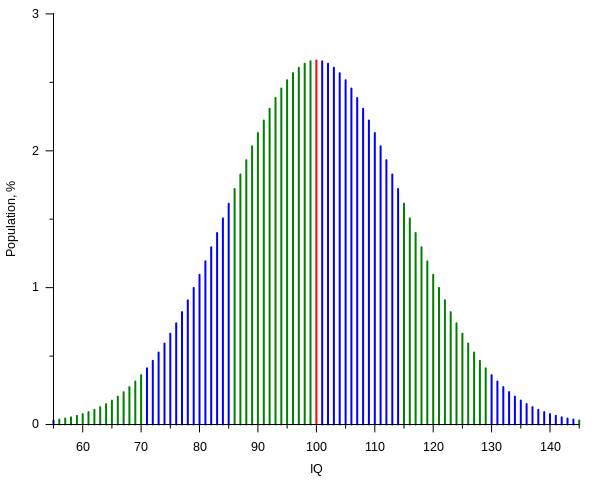
IQ curve
Autor:
Attribution:
Obraz jest oznaczony jako „Wymagane uznanie autorstwa” (attribution required), ale nie podano żadnych informacji o uznaniu autorstwa. Prawdopodobnie parametr atrybucji został pominięty podczas korzystania z szablonu MediaWiki dla licencji CC-BY. Autorzy mogą znaleźć tutaj przykład prawidłowego korzystania z szablonów.
Credit:
Praca własna
Krótki link:
źródło:
Wymiary:
600 x 480 Pixel (8735 Bytes)
Opis:
Current IQ tests typically have standard scores such that the mean score is 100 with each standard deviation from the mean counting for 15 IQ points.[1] The plot shows, assuming that such scores have a normal distribution, the percentage of people getting a score versus the score itself, from 55 to 145 IQ, that is over a span of six standard deviations. Spans are represented with different colors for each standard deviation above or below the mean. The plot was created with the following gnuplot code:
Licencja:
Warunki licencji:
Creative Commons Attribution-Share Alike 3.0
Więcej informacji o licencji można znaleźć tutaj. Ostatnia aktualizacja: Sat, 17 Sep 2022 11:02:58 GMT
