Ludność Nowego Sącza
Ludność Nowego Sącza
- 1939 – 34 000
- 1946 – 23 049
 (spis powszechny, 1942 - przyłączono Osiedle Westerplatte)
 - 1950 – 26 216
 (spis powszechny)
 - 1955 – 29 809
 (1951 – przyłączono Gołąbkowice, Helena, część wsi Piątkowa, )
 - 1960 – 34 179
 (spis powszechny)
 - 1961 – 35 300

- 1962 – 36 000

- 1963 – 36 400

- 1964 – 36 800

- 1965 – 37 438

- 1966 – 37 800

- 1967 – 39 000

- 1968 – 39 600

- 1969 – 40 000

- 1970 – 41 300
 (spis powszechny)
 - 1971 – 42 097

- 1972 – 43 100

- 1973 – 45 600

- 1974 – 46 615

- 1975 – 48 643

- 1976 – 50 200

- 1977 – 60 300
 (1977 – przyłączono Biegonice, Chruślice, Osiedle Dąbrówka, Falkowa, Poręba Mała, Zabełcze, Zawada, Kochanowskiego)
 - 1978 – 61 100
 (spis powszechny)
 - 1979 – 62 600

- 1980 – 64 094

- 1981 – 65 415

- 1982 – 66 985

- 1983 – 68 322

- 1984 – 69 734

- 1985 – 70 351

- 1986 – 71 863

- 1987 – 73 179

- 1988 – 75 217
 (spis powszechny)
 - 1989 – 76 738

- 1990 – 78 219

- 1991 – 78 980

- 1992 – 80 482

- 1993 – 81 238

- 1994 – 81 866

- 1995 – 82 301

- 1996 – 82 877

- 1997 – 83 290

- 1998 – 83 754

- 1999 – 83 911

- 2000 – 84 382

- 2001 – 84 465

- 2002 – 84 421
 (spis powszechny)
 - 2003 – 84 399

- 2004 – 84 463

- 2005 – 84 729

- 2006 – 84 487

- 2007 – 84 468

- 2008 – 84 475

- 2009 – 84 556

- 2010 – 84 537

- 2011 – 84 325

- 2012 – 84 129
 [1]
[1] - 2013 – 83 943
 [2]
[2] - 2014 – 83 853
 [2]
[2] - 2015 – 83 903
 [2]
[2] - 2016 – 83 993

- 2017 – 84 041

- 2018 – 83 896

- 2019 – 83 794

- 2020 – 81 435

- 2021 – 80 979

Wykres zmian liczby ludności
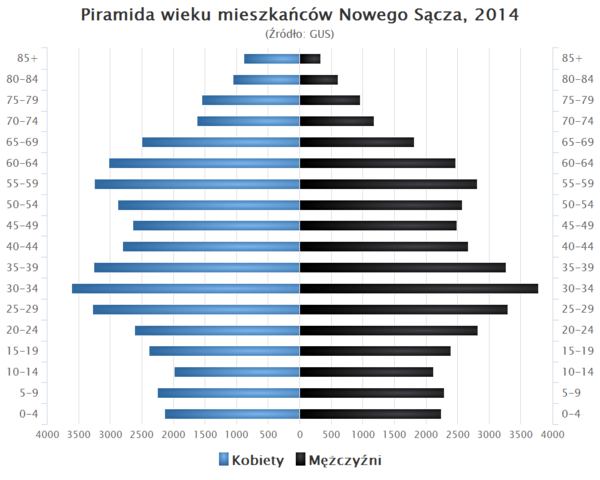
Piramida wieku mieszkańców Nowego Sącza w 2014 roku[3]
Powierzchnia Nowego Sącza
- 1995 – 57,06 km²
- 2006 – 57,58 km²
Przypisy
- ↑ Stan i struktura ludności oraz ruch naturalny w przekroju terytorialnym w 2012 r. Stan w dniu 31 XII. Główny Urząd Statystyczny. s. 71. [dostęp 2013-06-29].
- ↑ a b c Statystyczne Vademecum Samorządowca. [dostęp 2017-01-13].
- ↑ Nowy Sącz w liczbach, Polska w liczbach [dostęp 2019-04-07] (pol.), liczba ludności w oparciu o dane GUS.
Bibliografia
- 1939-1979 Roczniki statystyczne GUS
- 1980-1994 Roczniki demograficzne GUS
- 1995-2007 Bank danych regionalnych GUS
- 2008-2009 Roczniki demograficzne GUS
- Opracowanie GUS – „Ludność. Stan i Struktura w Przekroju Terytorialnym. Stan w dniu 31 XII 2009 r.”
Media użyte na tej stronie
Increase2.svg
Icon representing an increase, consisting of a green-colored, up-pointing triangle.
Icon representing an increase, consisting of a green-colored, up-pointing triangle.
Piramida wieku Nowy Sacz.png
Autor: Polskawliczbach, Licencja: CC BY-SA 2.5 pl
Piramida wieku mieszkańców Nowego Sącza, 2014
Autor: Polskawliczbach, Licencja: CC BY-SA 2.5 pl
Piramida wieku mieszkańców Nowego Sącza, 2014
Decrease2.svg
Icon representing a decrease, consisting of a red-colored, down-pointing triangle.
Icon representing a decrease, consisting of a red-colored, down-pointing triangle.


