Greenland Albedo Change
Autor:
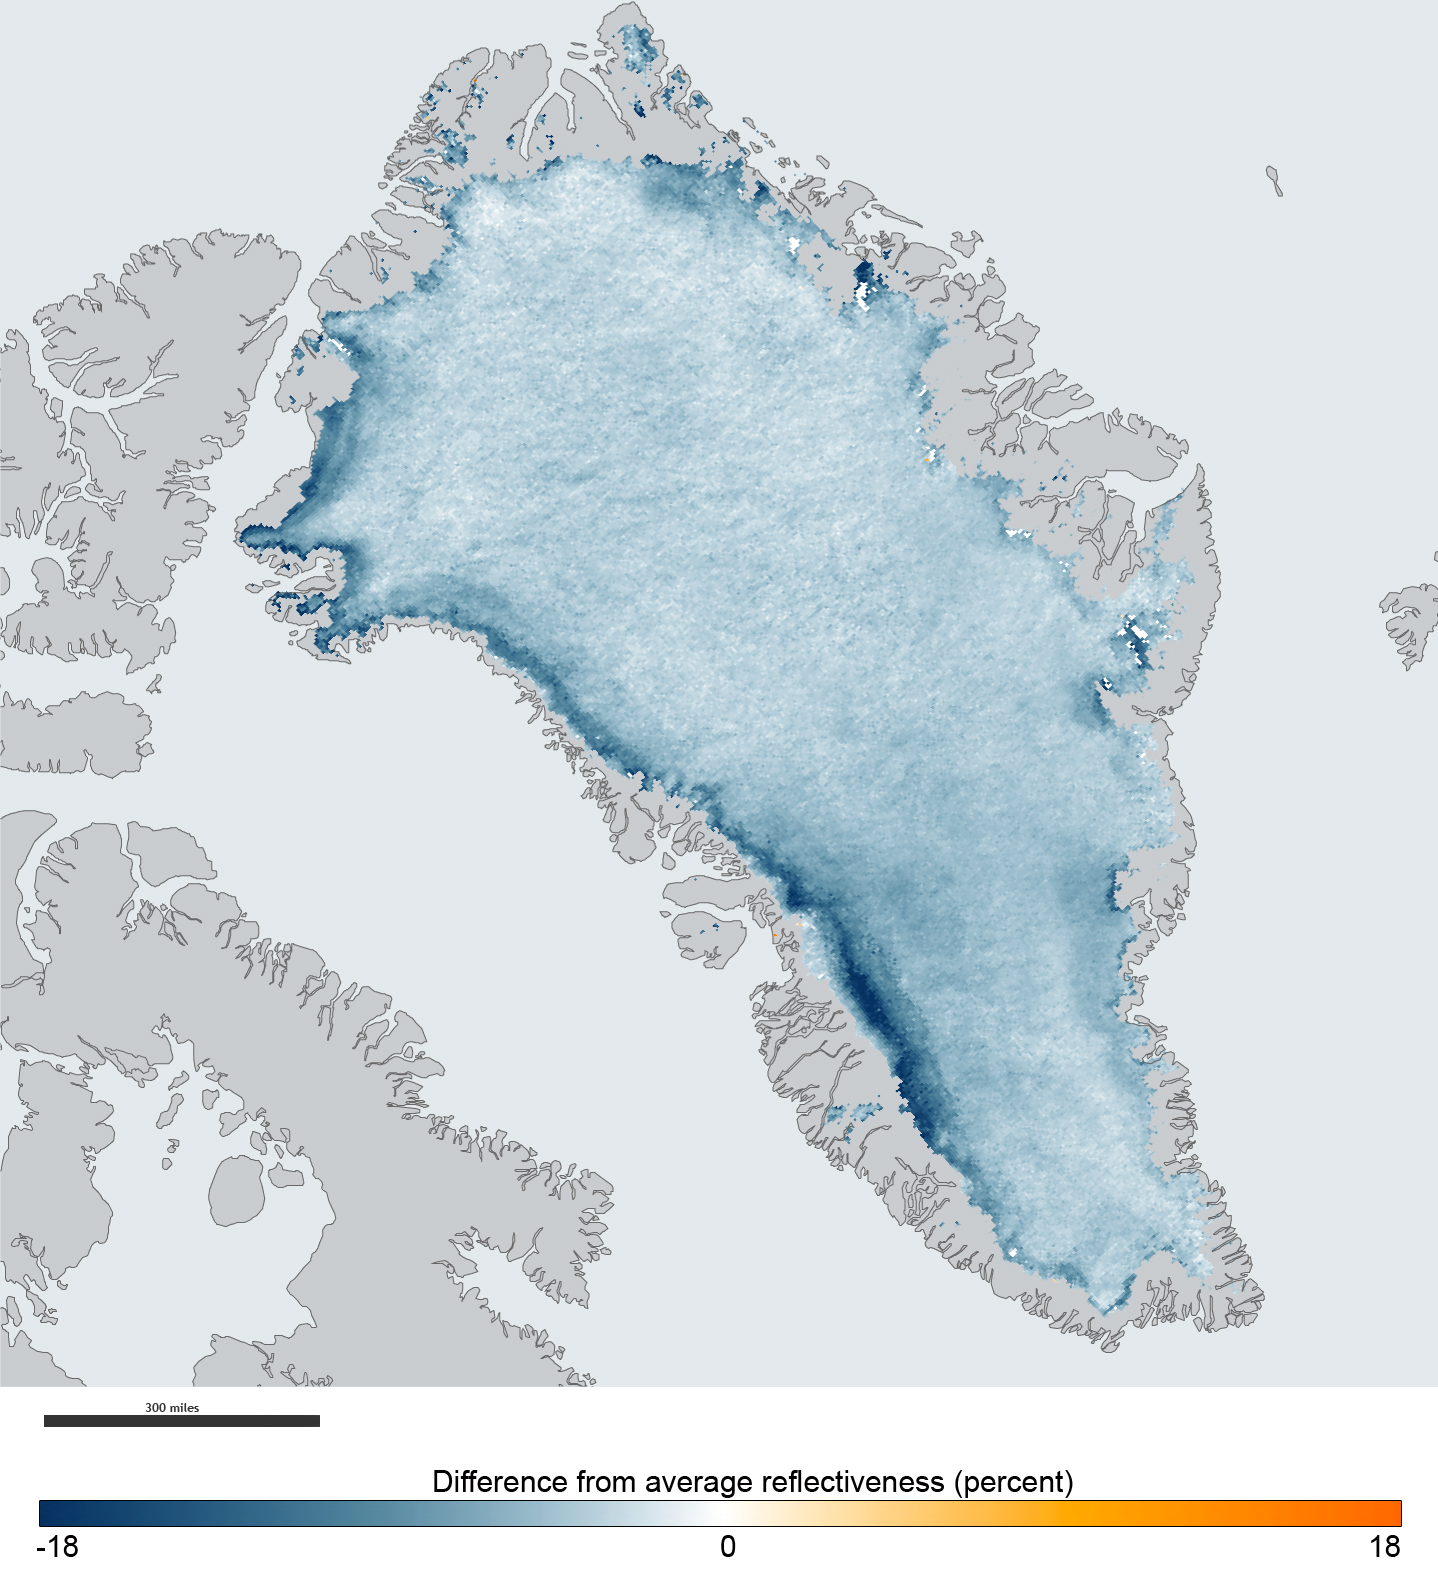
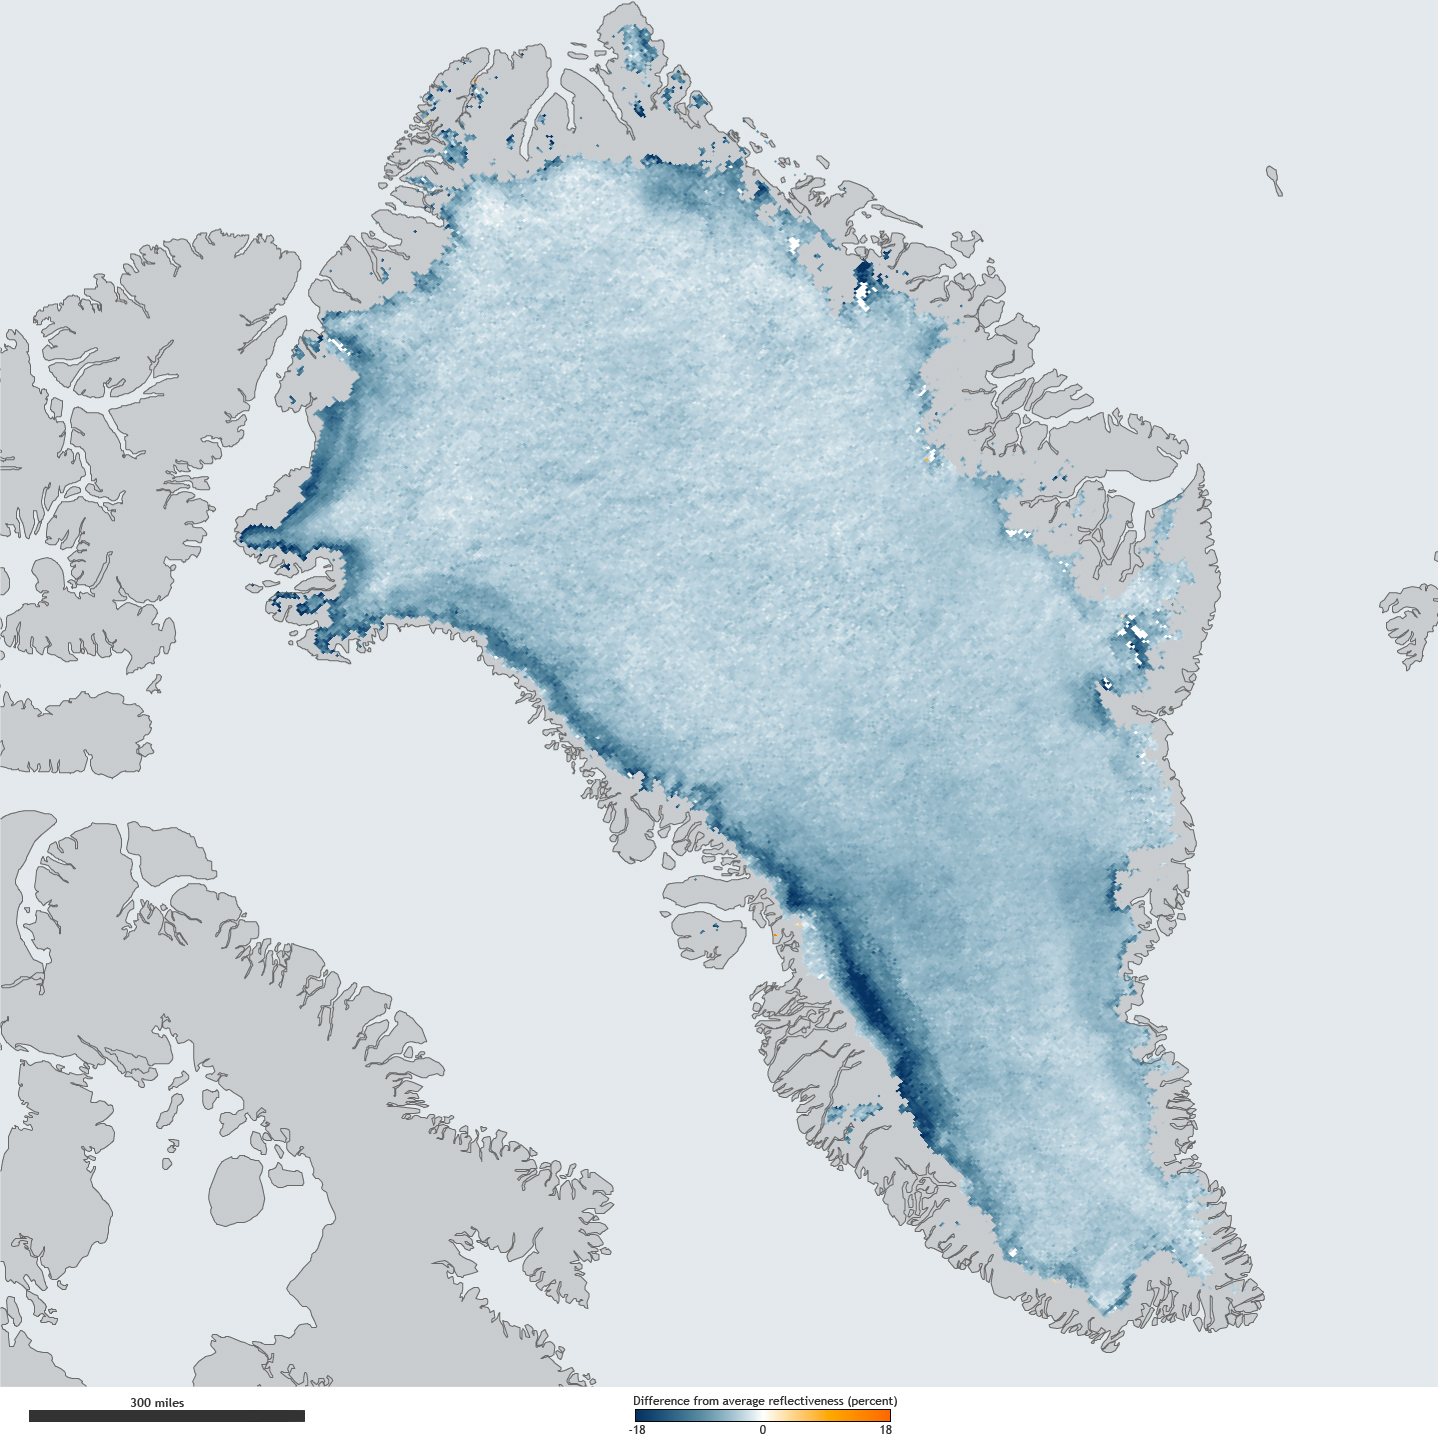
Map by NOAA’s climate.gov team, based on NASA satellite data processed by Jason Box, Byrd Polar Research Center, the Ohio State University. Scanning electron microscope photos courtesy the Electron and Confocal Microscopy Laboratory, USDA Agricultural Research Service.
Credit:
Krótki link:
źródło:
Wymiary:
1438 x 1584 Pixel (1558204 Bytes)
Opis:
The map shows the difference between the amount of sunlight Greenland reflected in the summer of 2011 versus the average percent it reflected between 2000 to 2006. Virtually the entire ice sheet shows some change, with some areas reflecting close to 20 percent less light than a decade ago. The map is based on observations from the Moderate Resolution Imaging Spectroradiometer (MODIS) instruments on NASA’s Terra and Aqua satellites. It was produced as part of the National Oceanic and Atmospheric Administration’s Arctic Report Card.
Licencja:
Public domain
Więcej informacji o licencji można znaleźć tutaj. Ostatnia aktualizacja: Sat, 12 Nov 2022 02:30:08 GMT