Haiyan 2013 track
Autor:
Credit:
Created by Meow using WikiProject Tropical cyclones/Tracks. The background image is from NASA. Tracking data is from the Joint Typhoon Warning Center[1].
Krótki link:
źródło:
Wymiary:
2700 x 1669 Pixel (2049373 Bytes)
Opis:
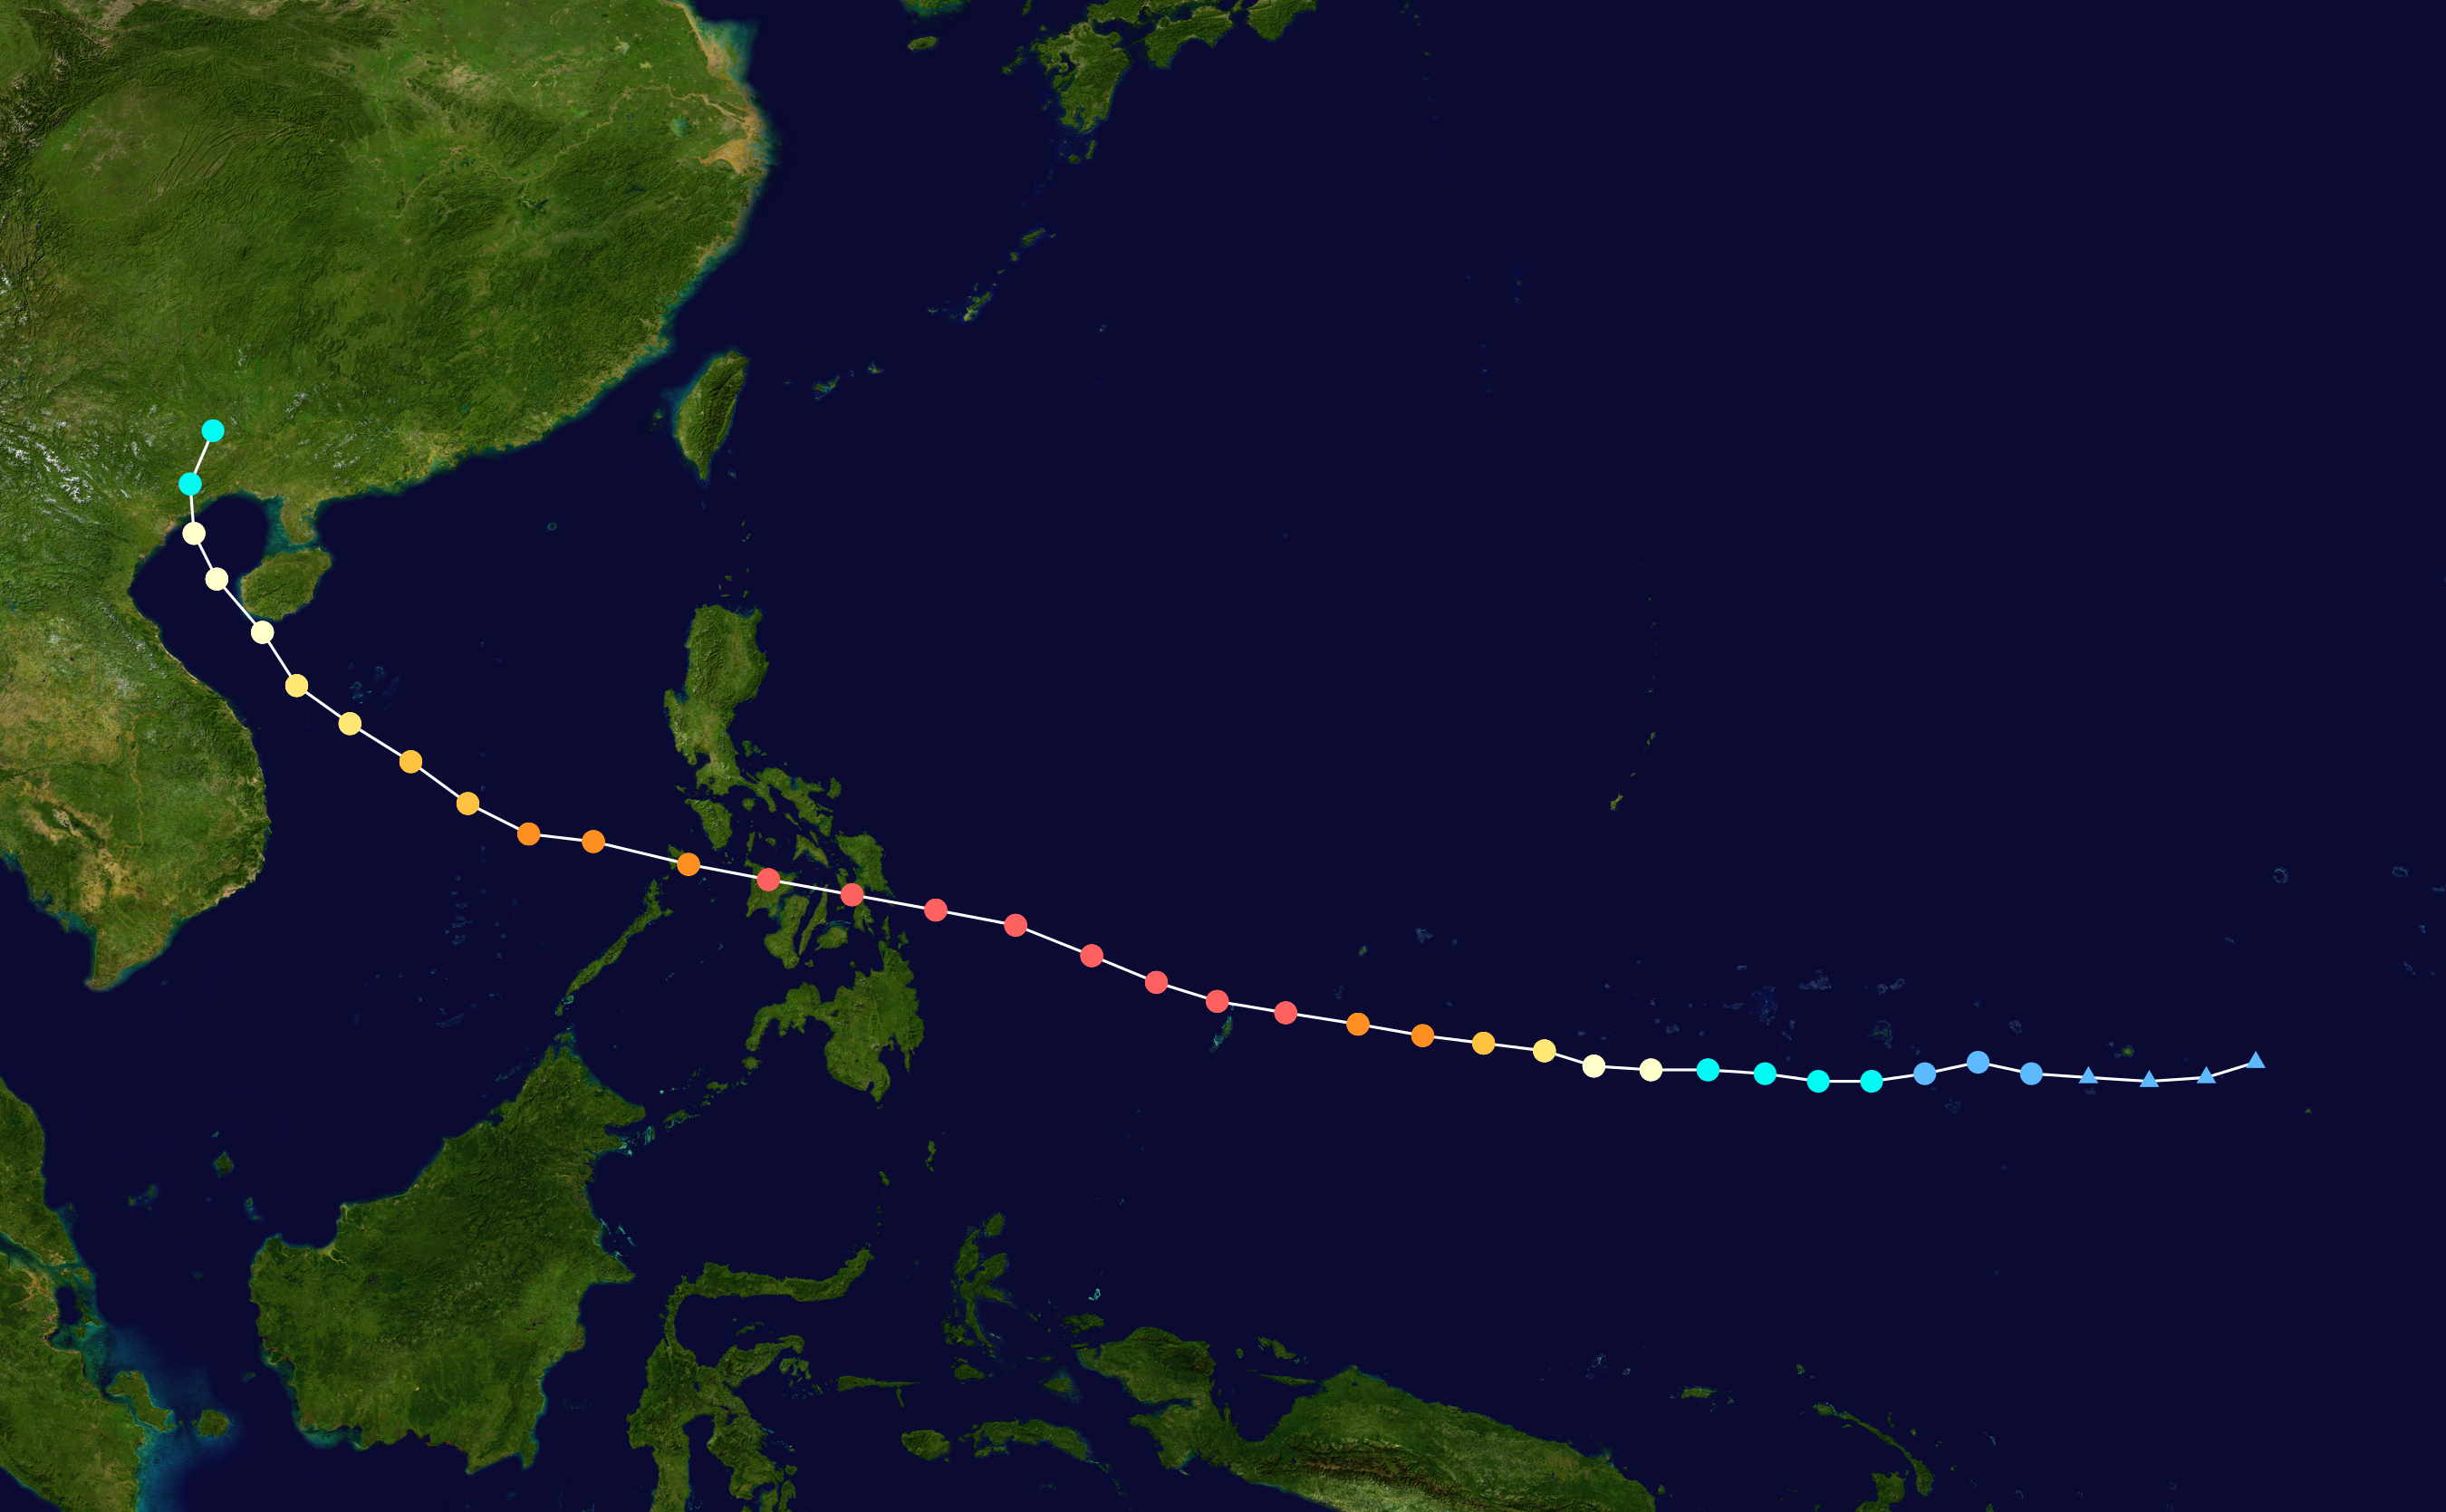
Track map of Typhoon Haiyan of the 2013 Pacific typhoon season. The points show the location of the storm at 6-hour intervals. The colour represents the storm's maximum sustained wind speeds as classified in the Saffir–Simpson scale (see below), and the shape of the data points represent the nature of the storm, according to the legend below.
 Extratropical cyclone / Remnant low / Tropical disturbance / Monsoon depression
Tropical depression (≤38 mph, ≤62 km/h)
Tropical storm (39–73 mph, 63–118 km/h)
Category 1 (74–95 mph, 119–153 km/h)
Category 2 (96–110 mph, 154–177 km/h)
Category 3 (111–129 mph, 178–208 km/h)
Category 4 (130–156 mph, 209–251 km/h)
Category 5 (≥157 mph, ≥252 km/h)
Unknown
Storm type
Licencja:
Public domain
Więcej informacji o licencji można znaleźć tutaj. Ostatnia aktualizacja: Sat, 31 Dec 2022 18:41:41 GMT