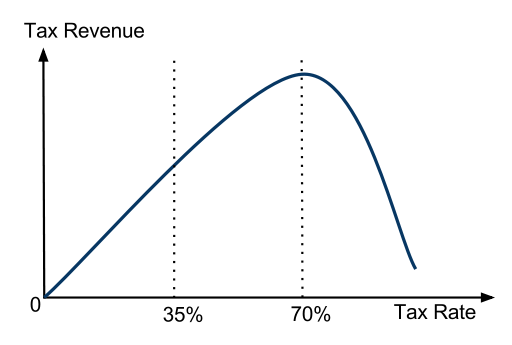
LafferCurve
Autor:
Credit:
Praca własna
Krótki link:
źródło:
Wymiary:
512 x 345 Pixel (25451 Bytes)
Opis:
A non-symmetric Laffer Curve with a maximum revenue point at around a 70% tax rate. This graph is based on the article "How Far Are We From The Slippery Slope? The Laffer Curve Revisited" by Mathias Trabandt and Harald Uhlig, NBER Working Paper No. 15343, September 2009. Specifically, it mimics the curve found in Figure 2 of that paper. Their research estimated Laffer Curve maximum revenue points to be between 60% to 80% tax rates.
Licencja:
Warunki licencji:
Creative Commons Zero, Public Domain Dedication
Więcej informacji o licencji można znaleźć tutaj. Ostatnia aktualizacja: Wed, 11 Jan 2023 01:42:37 GMT
