Typhoon Mawar 2005 computer simulation thumbnail
Autor:
- Typhoon_Mawar_2005_computer_simulation.gif: Atmoz
- derivative work: Atmoz (talk)
Attribution:
Obraz jest oznaczony jako „Wymagane uznanie autorstwa” (attribution required), ale nie podano żadnych informacji o uznaniu autorstwa. Prawdopodobnie parametr atrybucji został pominięty podczas korzystania z szablonu MediaWiki dla licencji CC-BY. Autorzy mogą znaleźć tutaj przykład prawidłowego korzystania z szablonów.
Krótki link:
źródło:
Wymiary:
450 x 403 Pixel (890339 Bytes)
Opis:
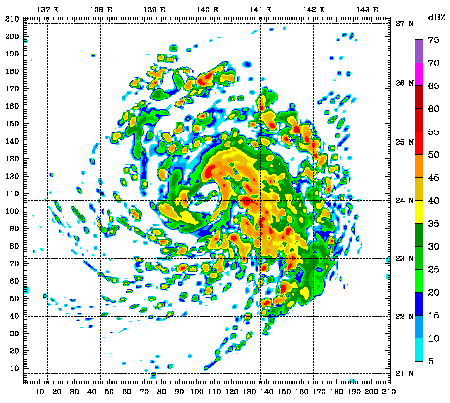
A 48 hour simulation of Typhoon Mawar using the Weather Research and Forecasting model. At this time, Mawar was at approximately 24N 140E and moving slowly to the north. Initial conditions and boundary conditions are from the 1 degree FNL reanalysis (approximately 110 kilometers, 68 miles). The simulation runs from 22 August 2005 00:00 Zulu to 24 August 2005 00:00 Zulu. The model has 3.3 kilometre (2.1 mile) grid point spacing, and utilizes vortex following which is why the typhoon remains in the middle of the frame. Approximately the first 24 hours (frames) show the model "spinning up"— which is the amount of time needed for the model physics to reach equilibrium with the applied boundary conditions. After the initial round of convection in the first couple frames, gravity waves can be seen propagating outward from the center of convection, especially in the northwest quadrant of the storm system. The final 24 hours (frames) represent a high resolution simulation of the actual typhoon. The reds and oranges represent high rainfall rates, blues and greens light rainfall, and the white are regions of no rainfall.
Licencja:
Warunki licencji:
Creative Commons Attribution-Share Alike 3.0
Więcej informacji o licencji można znaleźć tutaj. Ostatnia aktualizacja: Tue, 05 Jul 2022 20:12:29 GMT