Genetic Distribution
Autor:
Attribution:
Obraz jest oznaczony jako „Wymagane uznanie autorstwa” (attribution required), ale nie podano żadnych informacji o uznaniu autorstwa. Prawdopodobnie parametr atrybucji został pominięty podczas korzystania z szablonu MediaWiki dla licencji CC-BY. Autorzy mogą znaleźć tutaj przykład prawidłowego korzystania z szablonów.
Credit:
Praca własna
Krótki link:
źródło:
Wymiary:
512 x 510 Pixel (200195 Bytes)
Opis:
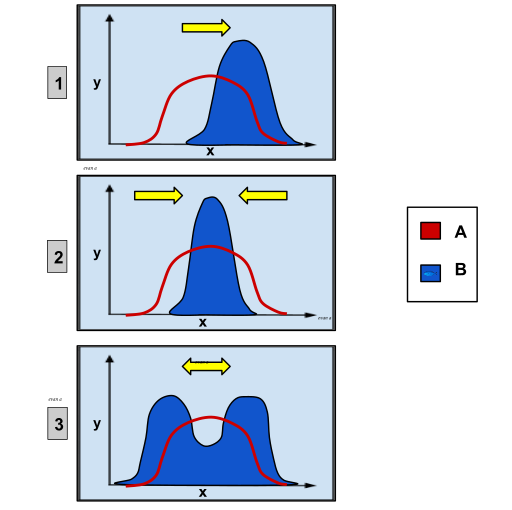
These charts depict the different types of genetic selection. On each graph, the x-axis variable is the type of phenotypic trait and the y-axis variable is the amount of organisms. Group A is the original population and Group B is the population after selection. Graph 1 shows directional selection, in which a single extreme phenotype is favored. Graph 2 depicts stabilizing selection, where the intermediate phenotype is favored over the extreme traits. Graph 3 shows disruptive selection, in which the extreme phenotypes are favored over the intermediate.
Licencja:
Warunki licencji:
Creative Commons Attribution-Share Alike 4.0
Więcej informacji o licencji można znaleźć tutaj. Ostatnia aktualizacja: Mon, 12 Dec 2022 19:50:54 GMT
